Wiser Technology Advice Blog
- HOME
- WISER-TECHNOLOGY-ADVICE-BLOG
- BUSINESS INTELLIGENCE
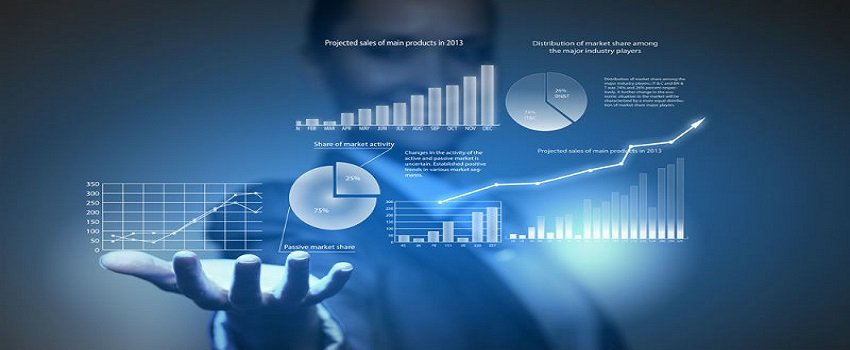
Business intelligence in the palm of your hand
28 July 2021
How can we get value from the masses of data captured by intelligent devices and created during day-to-day operation of businesses? These days there are some great tools available that can analyse data and provide intelligent insights into your business – known as business intelligence reporting systems.
This month I’ve been looking into alternatives for out-dated reporting software for one of my clients. I thought I’d share some interesting insights I’ve learnt on how you can take advantage of the latest trends in data analysis and reporting.
Business Intelligence - another marketing buzz word
Marketers love to come up with buzz words to sell their technology. Words such as ‘cloud’ to mean systems accessed through the internet, ‘Artificial Intelligence’ (AI) which is algorithms developed automatically by computers and ‘Internet of Things’ (IoT), a network of technology devices sharing data. ‘Business intelligence’ is another marketing buzz-word, with a wealth of meaning and depth behind it.

Business intelligence systems are data analysis and reporting tools that allow you to see, analyse and understand data for your business. Visualising and analysing historic, live and predictive data provides insights from data that supports intelligent decision making.
A picture’s worth a thousand words
Interactive reporting begins with data visualisation, using charts and graphs on dashboards. These are very high-level representations of the data, which can be clicked through to drill-down and reveal more information in ever-deeper layers of detail.

Being able to visualise the performance of an organisation provides a quick and simple way to monitor progress against goals. In the past, data tables, charts and graphs have been developed for management reports each month, quarter and year. Now, having business intelligence dashboards with interactive charts and graphs allows management to dig into why things are happening in real-time, without waiting on static reports to be prepared.
Business intelligence reporting can be used for a variety of purposes, such as:
- Tracking progress towards long-term strategic business goals
- Measuring key performance indicators of day-to-day operational performance
- Monitoring regulatory compliance
- Measuring and comparing performance versus that of competitors
Reporting for businesses has traditionally been done on historic data. But these days it’s not just about accepting a report that’s been provided once a month, now insights from live data can be provided in near real-time. Interactive reporting can include live data from operational systems immediately, as transactions are taking place. And with the introduction of machine learning artificial intelligence (AI) algorithms, we’re able to include predictive data in our reporting.
How is the data managed?
When data is created in day-to-day operations of a business, it’s stored and managed in transactional databases. These databases are designed and optimised for speed of creating and managing transactions.
Traditional reporting systems haven’t had the power or capacity to quickly provide reporting insights from transactional databases, needing reporting databases to be created separately with a design that’s optimised for speed of reporting.

Data warehouses are created by data analysts to combine data from many transactional systems and guide you through what they believe is the most relevant and valuable information for your business. Data presented through a data warehouse has been processed from the raw, transactional data created by systems used in your business operations, with data sometimes sourced from external systems. Data warehouses also provide data that’s been re-organised to support reports being created quickly and efficiently by the reporting system.
Data cubes have also been used to provide some deeper structure to data, allowing analysis and reporting from the data using pivot-table style reports. However, these are again limited to the design provided by data analysts and are constrained to limited amounts of data to ensure efficiency of reporting systems.
The latest trend is the use of data lakes, which pool together (pun intended!) data from a variety of sources to provide unlimited data for analysis and reporting. Data lakes contain raw, unstructured data from transactional systems, data from internet-of-things devices and data from cloud-based systems, which may be external to your business.
The masses of data held in data lakes provides a fabulous source of information for machine learning / deep learning algorithms, that underpin data analysis and reporting software using ‘Artificial Intelligence’.
Creating value from data
Information is core to the success of any organisation and high value information can be created if you have good quality data being combined and analysed.

You can use data analysis to uncover a wide range of opportunities, understanding the overall trends of your business and allowing you to manage it efficiently. For example:
- Cut loose parts of the business which are running at a loss. For example, you may be creating and selling a product that was historically in high demand but that only a few customers still want to pay for.
- Identify trends with many small issues that are creating unrecognised large and wide-spread problems.
For example, workers that are out on the road may be backtracking over their routes and crossing over with other people’s routes, which they see as a day-to-day frustration. Optimising travel routes for workers can save huge amounts in fuel costs and time paid to workers. - Get a better understanding of the demographics of your customers.
This has a wide range of benefits, for example more targeted advertising to the type of people you know would be interested in buying your products and services. - Manage your spending better by understanding what is purchased, how often and from whom.
This allows you to negotiate better deals with suppliers and tighten up budget control.
Artificial Intelligence
The market leaders in data analytics and reporting software systems have introduced use of machine learning / deep learning algorithms (Artificial Intelligence) to analyse vast volumes of data and provide instantaneous data analytics.

Artificial Intelligence systems can find insights that would go unnoticed by human data scientists. Prior to AI systems, organisations would employ data scientists to trawl through millions of bits of data collected from the processes and run queries to gain insights. Despite employing teams of data scientists and analysts, organisations would miss out on the nuances of data that could tell the hidden aspects of the process. AI systems can provide new ways to sift through the data and interpret information more clearly. The AI algorithms can process large datasets quickly and drive value creation with predictive and prescriptive analysis.
With AI and data analytics, organisations can make accurate predictions, identify buying patterns, clearly anticipate situations, aim for advanced analytics, and make overall better decisions.
Market leaders in business intelligence software
There is a huge variety and scope of software solutions that may be feasible for adoption by your business.
To make sense of this fragmented and diverse market, I have consulted the Gartner report released in February 2021, with a magic quadrant comparing analytics and business intelligence platforms. The market leaders reported in the Gartner magic quadrant are Microsoft, Tableau and Qlik.
The Gartner report delves into the pros and cons of each of the software systems they compared, so I encourage you to download and read their report (I’ve included links in the Further Reading section below).

Microsoft Power BI is included with enterprise licensing for Office 365, so it would be a natural choice of analysis and reporting software for large organisations. The three market leaders, Microsoft, Tableau and Qlik, all offer cloud-based software solutions that could meet the need of any business, no matter how large or small.
What’s right for your business?
Now that you know what’s possible, which of these data structures and software systems is going to be right for your business?
I encourage you to look beyond the obvious when you’re considering a new software system and investigate all the options that could meet your needs. If you’re feeling overwhelmed by the world of technology, I’m here to help with wise, independent advice.
Do you need to go out to market for new data analysis and reporting software and want trusted independent expertise for the procurement activities? I specialise in guiding you through the complexities of preparing a request for tender and leading your team through the evaluation process.
Please get in contact today if you’d like to have a chat about how I can help you, I’m always happy to meet over a coffee.
Further reading:
2021 Gartner Magic Quadrant reprint, available by signing up at https://info.microsoft.com/ww-Landing-2021-Gartner-MQ-for-Analytics-and-Business-Intelligence-Power-BI.html?LCID=EN-US
OR by signing up at https://www.tableau.com/reports/gartner
OR by signing up at https://www.qlik.com/us/gartner-magic-quadrant-business-intelligence
Business Intelligence Reporting: A Complete Overview, LogiReport, available at: https://www.jinfonet.com/resources/bi-defined/bi-reporting/
Business Intelligence, Reporting Management & Data Science, ThoughtExecution, available at: http://thoughtexecution.com/bi_reporting.php
Business Reporting, IntelliData Solutions, available at: http://intellidsi.com/business-intelligence/business-reporting/
Data Lake vs Data Warehouse https://www.talend.com/resources/data-lake-vs-data-warehouse/
Data Visualisation - Microsoft Power BI, Microsoft, available at: https://powerbi.microsoft.com/en-us/
The Real Difference Between Reporting and Business Intelligence, 26 June 2018, ReportsNow, available at: https://reportsnow.com/the-real-difference-between-reporting-and-business-intelligence/
